Insights from the Labor Force Participation Rate
Ari Fenn, Researcher
December 23, 2020

The labor force participation rate measures involvement in the labor force, defined as the currently employed people or those actively searching for employment. The percent of the noninstitutionalized population over the age of 16 who are either employed or actively seeking employment in the labor force is known as the Labor Force Participation Rate (LFPR).
In February of 2020, the state of Utah’s participation rate was 7.9% higher than the nationwide average, and this followed a 42-year trend of Utahns being more likely to participate in the labor market than their peers nationally. Additionally, Utah saw a much smaller drop in the LFRP as a result of the COVID recession. While the future is always uncertain, we can benefit from a deeper understanding of the labor force participation rate.
Why should we care?
In short, we should care about the LFPR because, as citizens, it gives a multidimensional understanding of employment situations. As researchers, it gives us insight into structural changes, and as policymakers, it allows us to visualize or ask about who our most vulnerable populations may be.
The labor force participation rate is informative regarding both changes in short-term expectations and the long-term structure of the economy, including what types of jobs are available and the skills needed for those jobs. The labor force’s size can change without a change in the population’s size due to how the labor force is calculated. The labor force may vary with changes in sentiments or the structure of the economy.
Short Term
Changes in labor force participation during the business cycle can be informative of people’s perception of the economy’s strength and affect the unemployment rate. Unemployment is measured as the number of people without a job who are actively searching for employment divided by the labor force. During a recession, as job losses mount, some people will become discouraged with the prospects of finding a job and stop actively searching for employment. As people drop out of the labor force, both the numerator and denominator become smaller. But the numerator will shrink by a larger percentage, which leads to an artificial decrease in the unemployment rate. On the other end of the business cycle, as GDP expands and the unemployed begin finding jobs, some people who left the labor force will re-enter, which can mute employment figures during recoveries.
The COVID pandemic sparked the largest single-month decrease in the LFPR, dropping from 62.7% in March to 60.2% in April. This drop was the lowest it had since January of 1973 when it was at 60%. It has subsequently risen slightly to 61.5%. This rise can partially be attributed to state and local governments’ actions to slow the virus’s spread, mainly affecting foodservice and hospitality industries making short-term job searches nearly impossible. Long term effects might include a lower post-recovery plateau as more people acquire skills to enter into jobs that will allow for remote and more stable work should something similar happen again.
Long Term
Trends in the labor force participation rate can point to changes in the structure of the economy. Figure 1 shows the last 60 years of the female labor force participation rate, with a steady increase between 1950 and the late 1990s. The increase in women’s participation rate coincides with changing social norms -- it became more acceptable for women to move from unpaid care labor in the home to paid market labor. Additionally, the “traditional” care work that was expected to be done by women at home became available through market transactions. This further allowed women to take larger roles in the labor market.
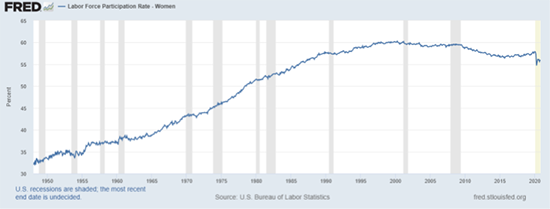
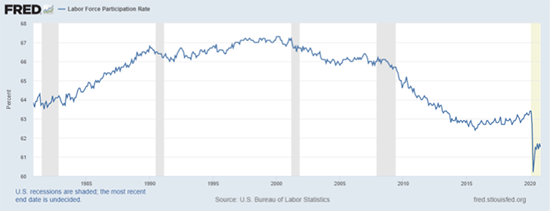
Figure 2 indicates that trends in labor force participation over the past 30 years paint an interesting picture. Labor force participation peaked before the 2000 recession. After the recession, there was a dip followed by a mild increase before the Great Recession. The Great Recession led to a two-year decline in labor force participation, a three-year plateau, then seven years of soft recovery before a “peak” 2.1 percentage points below the 2007 peak and 3.5 percentage points below the highest peak in 2000. This lower level of labor force participation might be attributed to people just out of high school pursuing education before entering the labor market.
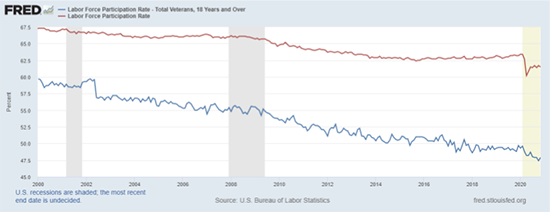
The labor force participation rate can be compared across regions or demographics. This comparison is informative about how some groups might experience the labor market differently than others. Labor force participation is much lower and declining for veterans than overall labor force participation, as in Figure 3. This decline may be attributed to the prolonged effects of the mental and physical toll that military service takes.
In the above examples the labor force participation rate was used to show changing gender roles in the economy, potential structural shifts after two recessions and how different groups of people have different relationships to the labor market.
References
U.S. Bureau of Labor Statistics, Labor Force Participation Rate - Women [LNS11300002], retrieved from FRED, Federal Reserve Bank of St. Louis; https://fred.stlouisfed.org/series/LNS11300002, December 18, 2020
U.S. Bureau of Labor Statistics, Labor Force Participation Rate [CIVPART], retrieved from FRED, Federal Reserve Bank of St. Louis; https://fred.stlouisfed.org/series/CIVPART, December 18, 2020.
U.S. Bureau of Labor Statistics, Labor Force Participation Rate - Total Veterans, 18 Years and Over [LNU01349526], retrieved from FRED, Federal Reserve Bank of St. Louis; https://fred.stlouisfed.org/series/LNU01349526, December 18, 2020.