Troubleshoot and Validate Data with Pandas Profiling
Vincent Brandon, Data Coordinator
April 21, 2021

This post will cover the use of metadata reports with Pandas profiling to troubleshoot and validate common data issues. With a few lines of code, you can generate rich profiles for each column in your dataset. The Pandas profiling library will calculate correlation matrices that may be of use before modeling. For this example, I use the minimal flag to only look at basic descriptive statistics for each column.
Imagine a data request to see how GPA tracks with SNAP (food assistance) eligibility over time.
Missing Data
One big issue with any data request is how to handle missing data. We try to give as much context as to why data might be missing, but sometimes we are not sure. Is it really missing? Is it missing because a join condition left out some records, and it should be a false value instead of a null? Missing values impact population and test/train splits significantly. Naively dropping rows may introduce bias. It is better to know soon if there is an issue.
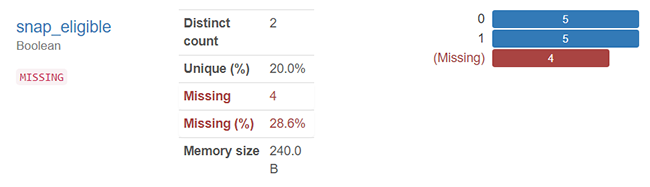
Pandas profiling in the above example gives us a big warning flag. A lot of our data is missing. There might be so much missing data from a key indicator that more demographic data is needed to build around the hole in some cases.
Missing or Malformed Populations
Most UDRC reports have significant sub-populations of interest for our researchers. These are often broken down across demographic lines but may be done by industry codes, wage percentiles, or other interest factors. In Figure 2, we see an interesting problem that arises when data is not cleaned properly.
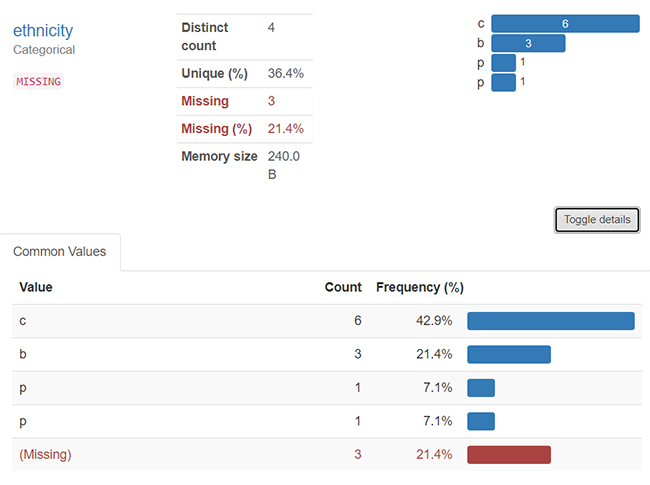
Can you see it? Whitespace, capitalizations, and sometimes weird text encodings can make populations different when they should be the same. Pandas profiling reports offer a great ‘Toggle details’ button to get more insight. It looks like the ethnicity ‘p’ is repeated. But is it? If we dug into the CSV, we would find that one of the values was padded with whitespace. This “padded” variable will create an extra category in most models and can be missed. While it is best practice to sanitize every column in a dataset before modeling, it may not be practical to do so in early exploration. Nevertheless, here, we need to clean this up.
Validate Censoring and Truncation
The research scope is important. Imagine we only want the cohort of students who started 10th grade or graduated from 2014 through 2018. This cohort implies two limits. A right censoring is used, where no students in this dataset should present records beyond 2018 and where the graduation or dropout event does not occur in our window. Additionally, a left truncation is used, where no student reached grade level 10 before 2014. In practice, your request cohort could be described any number of ways. Using this description, though, did our reporting functions pull the data correctly?
Not quite! Our right censoring seems to be working. It is 2021 now, and none of the students have records past 2018. Success; however, a good portion entered the 10th grade before 2014. This portion is not the study population we wanted, and we need to do more work on the data query.
In addition, Pandas profiling can create an exportable .html file that is easy to communicate amongst team members. We use it in query reviews and send it with our data requests.
Ready for data? Submit a request at udrc.utah.gov. What kind of metadata have you found of use? Let us know on Twitter @udrc.
References
Lunn, M. (2007). PDF [http://www.stats.ox.ac.uk/~mlunn/lecturenotes1.pdf]. Oxford: Undergraduate lecture notes BS3b: Statistical Lifetime Models.