The Migration to College of Utah
High School Graduates

Published March 2022

Overview

This data narrative explores Utah"s high school graduates (USBE) from 2013 - 2016 and analyzes their enrollment and migration patterns to Utah's colleges.

Following or nearing high school graduation, students are faced with two choices related to post-secondary education:

The demographic, geographic, and economic circumstances of a graduating high school student play a prominent role in each student’s decision to enroll in post-secondary school and enroll for their post-secondary education.

Keep scrolling to view the key findings of Utah"s high school graduates.

Key findings from the report include the following:

Finding #1: Enrollment

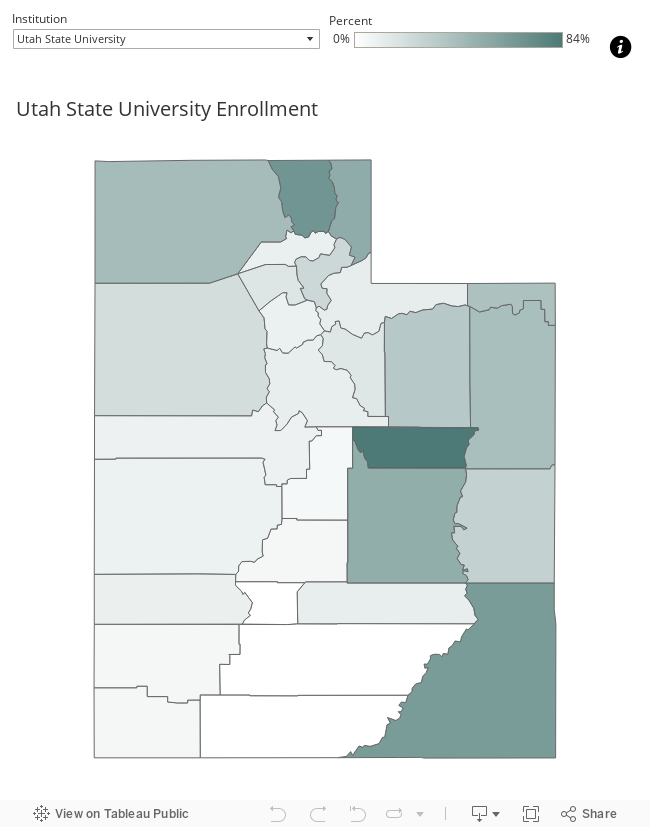
  • If students enroll in post-secondary school, they most frequently enroll in their home service region.
  • Students are more likely to travel a further distance to a main campus if enrolling in a degree-granting institution as compared to a technical college.

Finding #2: Migration

  • A decision to enroll in post-secondary school inside or outside of a student’s home service region (migration) was primarily influenced by the institution of choice for each student and the student's ACT composite score.
  • Students who enrolled in a USHE institution still most frequently chose a school in their home service region.

Finding #3: Demographics

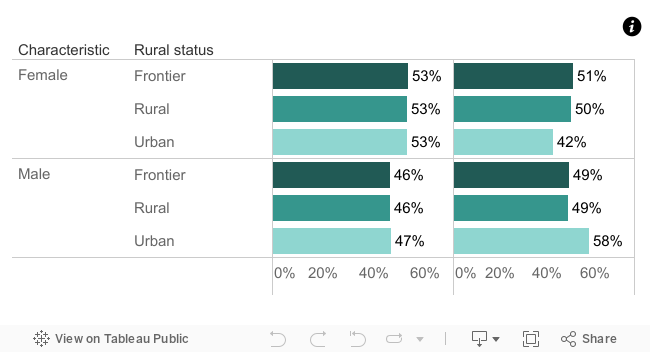
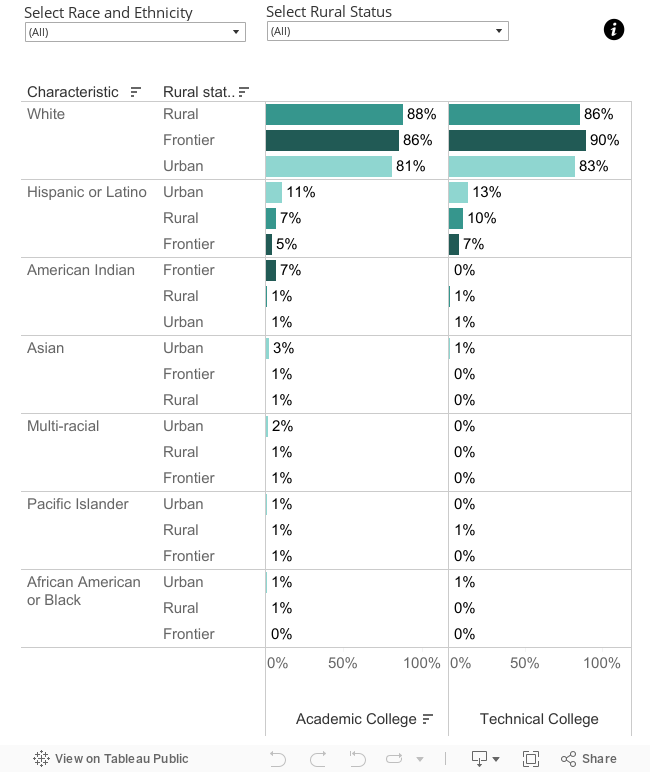
  • Student demographics, such as race, ethnicity, gender, and type of high school graduation - diploma versus GED - and other socioeconomic indicators, play an important role in post-secondary enrollment.
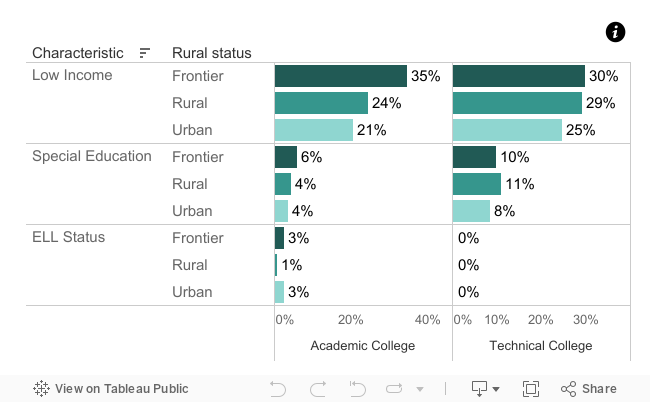
  • Students from low-income families, learning English, or enrolled in special education were less likely to enroll in post-secondary education. Technical Colleges had a higher percentage of their total enrollment composed of special education students.
  • Those students with a high school diploma were more likely to enroll in post-secondary education than those with a GED.

*Note: Rurality is based on the Utah Dept. of Health (UDOH) county classifications map.

Glossary of Terms

Finding 1: If students enroll in college, they most frequently enroll in their home service region

Utah students
attending a
degree-granting
school
tend to
travel further
from home

Utah students
attending a
technical
school
tend to
stay close
to home

Major Findings

  • For most schools, students attend close to home.
  • However, of the students who enrolled at Southern Utah University or Snow College, over 70% of them come from outside the region.

Instructions for Map

  • This map represents only students who enrolled in post-secondary Utah institution. For example, of students enrolling in college from Cache County, 78% enrolled in Utah State University.
  • Select a school in the dropdown to see the county sources of college enrollers.
  • Darker shaded counties indicate a higher percentage of college enrollers in the selected post-secondary institution.
  • Hover over the map to view information for each county.
Figure 1: This map shows enrollment percentages for high school graduates that enrolled in a Utah public college.

Finding 2: A decision to enroll in college located near or far from home was primarily influenced by school choice and rurality of their home county

Enrollment in
college
is generally
from students
living close to
the institution

Southern Utah
University
draws
students from
all over
Utah

Major Findings

  • Enrollment in post-secondary institutions generally includes students from counties that are close to the institution.
    • The only outlier to this trend is Southern Utah University (SUU), which draws a large number of students from around Utah.
    • The satellite campuses and centers located around the state may explain part of USU’s broad statewide enrollment.
  • Urban counties, such as Cache and Salt Lake, had a comparatively higher percentage of students who enrolled in their service region than out of their service region, compared to rural and frontier counties.
  • Frontier counties, such as Garfield and Morgan counties, had higher percentages of students enrolling outside of their service regions as compared to urban areas.

Instructions for Graph

  • Choose a county (or counties) from the dropdown list to see percentages of students that enroll in colleges in the USHE service regions where they graduated from high school.
  • For a complete list of Utah degree-granting institutions and technical college service regions, see the full report.
  • The Sankey diagram also shows the percentage of students enrolling outside of their home service region and the percentage of students from each county that did not enroll in degree-granting institutions and technical colleges.
  • Hover over each line for each county to see the number of students in each enrollment category.
  • Note: Enrollment percentages (on the right of the graph) are a total of all counties displayed in the county color key. To update those numbers, select different options in the counties dropdown list.
Figure 2: This graph shows percentages of students and where they enrolled in college, whether in their school region, outside the region, or whether they did not enroll.

Finding 3: Student demographics (such as gender, race, ethnicity, and other socioeconomic indicators) play an important role in college enrollment

Gender and Rurality Characteristics

Frontier
technical college

enrollees include
51% female
49% male

Frontier
degree-granting institution

enrollees include
53% female
46% male

Major Findings

  • Females enrolled in degree-granting schools more frequently than males.
  • Additionally, this trend of more females enrolling does not vary much by rurality.
Figure 3: This figure shows gender and rurality area statistics for students enrolled in any degree-granting institute or technical college.

Race and Ethnicity Characteristics

Frontier
technical college

enrollees include
90% White
3% Native American

Frontier
degree-granting institutions

enrollees include
85% White
7% Native American

Major Findings

  • Most students from minority racial and ethnic backgrounds chose to enroll in post-secondary institutions from urban areas.
  • This enrollment trend is likely reflective of the fact that minority students tend to be concentrated in the state’s urban areas.
  • However, this trend does not hold true for Native American/American Indian students - this group mostly originates from frontier regions.
  • Conversely, white students tended to enroll evenly in post-secondary institutions regardless of the population density of their origin.
  • Again, this is generally reflective of the demographic composition of the frontier, rural, and urban areas in the state.
Figure 4: This figure shows geographic enrollment percentages of students based on their race and ethnicity.

Other Student Characteristics

Rural
technical college

enrollees include
11% special education
29% low income

Frontier
degree-granting institutions

enrollees include
4% special education
35% low income

Major Findings

  • Students experiencing low income, students learning English, and those enrolled in special education were less likely to enroll in post-secondary education.
  • Technical colleges drew a higher percentage of special education students as a percentage of their total enrollment.
Figure 5: This figure explores geographic enrollment percentages of English language learning students, special education students, and low-income students.

Limitations

  • This research does not account for students who enrolled in institutions outside of the USHE system. For example, students may have enrolled in institutions out of state or have enrolled in a private institution within Utah.
  • High school graduates could be included in analyses twice if they enrolled in a degree-granting institution and technical college.
  • Some post-secondary institutions have satellite campuses - this research considers the main campus to be the location of attendance as data assigning a student to a particular satellite location was not available.
  • Groups with less than ten people have been zeroed out for data privacy.
  • The analyses in the study are much more in-depth than what can be covered in this narrative. The study analyses controlled for student demographics, such as: Gender, race, ethnicity, type of high school graduation (GED versus traditional four-year diploma), ACT composite score, low-income status, and special education enrollment, among others.
  • The study also accounts for the median household income of each students’ county where they graduated from high school (home county).
  • Median household income data was sourced from the US Census Bureau (US Census Bureau, 2019).

Conclusion

  • Generally, those enrolling in post-secondary education enrolled within their home service regions, though exceptions to this exist, especially for frontier counties.
  • Different institutions offer courses and degree programs in various areas of study, so depending on a student’s interest in a particular area of study, this may largely influence their decision to leave their service region and attend an institution farther away.
  • High school graduates with traditional four-year diploma awards were more likely to enroll in post-secondary education than those earning GEDs.
  • Students enrolled in special education, students learning English, and students experiencing low-income situations were less likely to enroll in post-secondary education programs.

Full Report

Learn more about Utah high school students migrating to college

Read the full report to learn more about the migration to college of Utah high school students. This study includes detailed breakdowns of the demographic, geographic, and economic circumstances of graduating students. Specifically, the analysis consists of an in-depth look at gender, race, ethnicity, type of high school graduation, ACT composite score, low-income status, special enrollment, and other factors.

Utah wage gap report cover

Glossary:

Project
Team

Kelsey Martinez
Kelsey Martinez, PhD

Research Manager
(Analysis/
Report Author)

Laura Dahl
Laura Dahl, PhD

UX Researcher
(Graphics/
Web Design)