Area Deprivation
and the P20 Pipeline

Published December 2021

Overview

This narrative explores the relationship between Utah's P20W metrics and the overall social and economic health of a given area, known as area deprivation. In addition, it answers the question: Does where a student lives in Utah play a role in their educational and workforce success? This research uses the Utah Department of Health's Health Improvement Index (HII) along with UDRC's unique education and workforce data.

Generally, education outcomes play an important role in determining long-term labor market success. In previous research, UDRC established this relationship in Utah by showing higher spending and higher wages. Additionally, the UDRC has shown how education outcomes vary by differing demographics. This study adds to existing knowledge by establishing a relationship between education outcomes and the area of residence of Utah students.

Summary of Findings

Finding 1: Descriptive

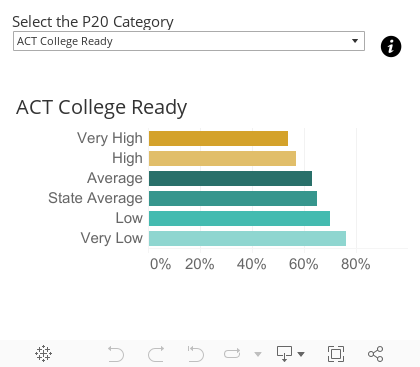
  • Before controlling for characteristics of the students, the High and Very High deprived groups have the highest percentage of students with adverse outcomes.
  • The Very High deprived areas consistently have a higher proportion of adverse outcomes than the state average.
  • The Very Low deprived areas have a lower proportion of adverse outcomes compared to the state average.

Finding 2: Demographics

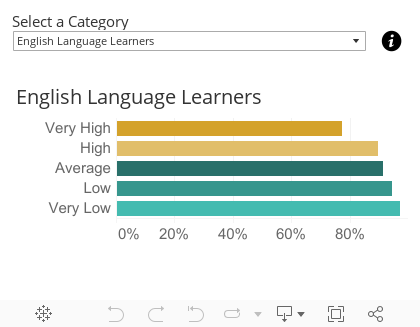
  • The High and Very High deprived areas have the highest proportion of students who are low-income, experienced homelessness, and are English language learners (ELL).
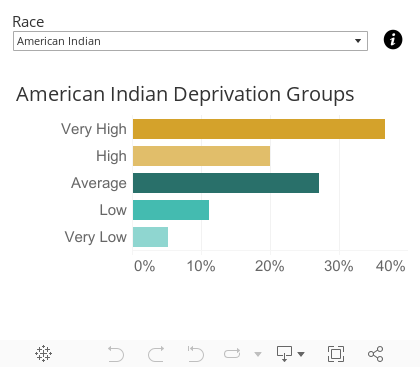
  • The High and Very High deprived areas have a higher proportion of minorities than the Low and Very Low areas.

Finding 3: School Readiness

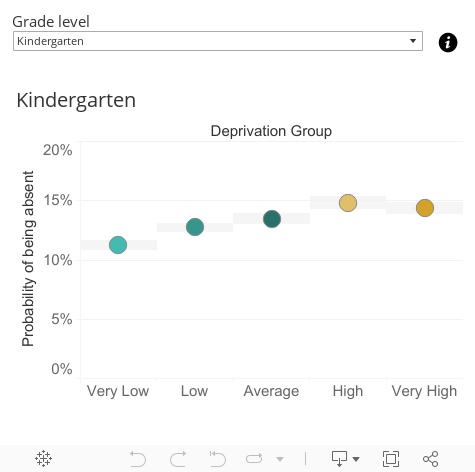
  • Students from the highest deprived areas enter kindergarten as the least likely to be prepared to start school.
  • Students from the lowest deprived areas are most likely to be prepared for school when entering kindergarten.
  • As HII (deprivation) increases, the probability of being ready for school, entering kindergarten, decreases.

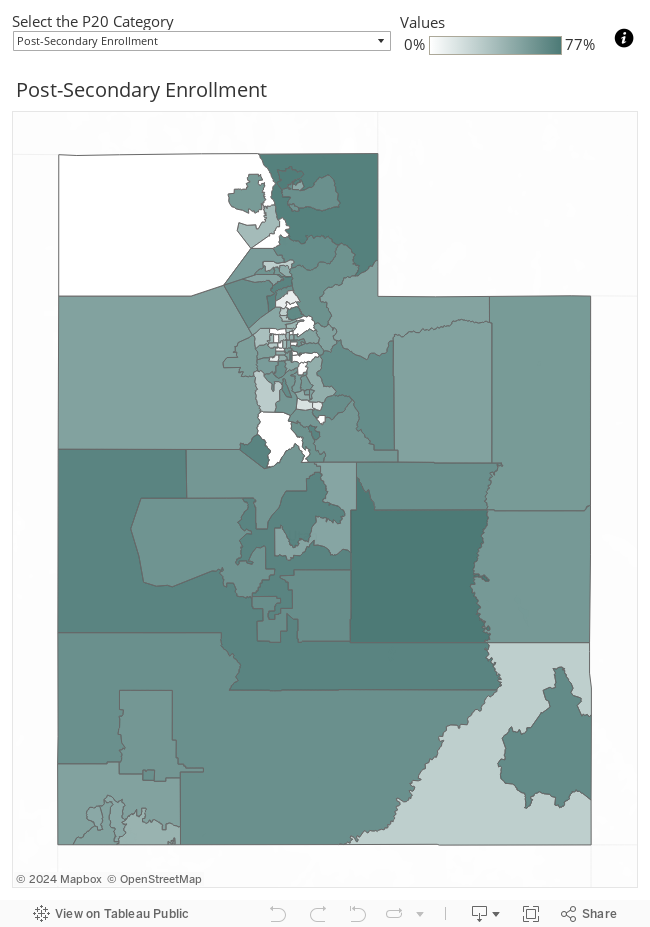
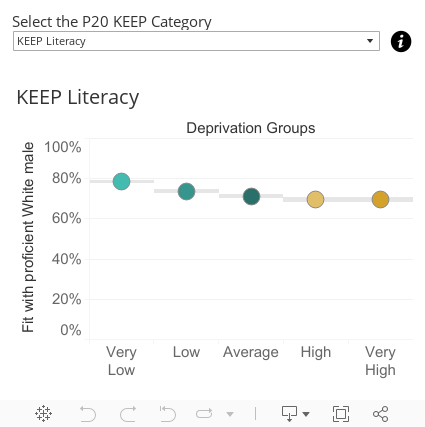
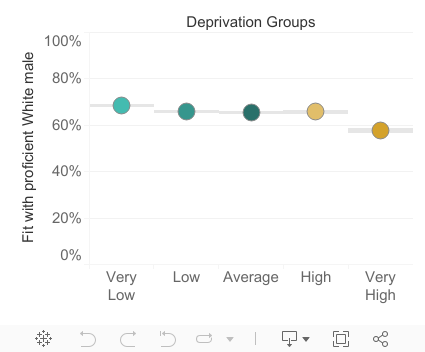
Finding 4: Post-Secondary Attendance

  • Students from the Very High deprivation areas are least likely to attend any college or university.
  • Students from the Very Low deprivation areas are most likely to attend any college or university.

Finding 5: Chronic Absenteeism

  • Students from the Very High deprivation areas are most likely to be chronically absent at the earliest and latest grades.
  • Students from the lowest deprivation areas are least likely to be chronically absent in the earliest and latest grades.
  • During the middle grades, students from the Very High deprivation areas are less likely than students from the Very Low deprivation areas to be chronically absent.

View Glossary of Terms

Detailed Findings

About the Findings

Using pooled outcomes from the 2017 and 2018 school years, this research first provides a descriptive overview of 12 P20 metrics by deprivation group. Individual characteristics of students were controlled using regression analyses. Finally, the estimates are used to provide predicted probabilities for each P20 metric to test if the association only exists due to demographic differences between areas or if the relationship between area deprivation and P20 metrics still exists.

Finding 1: The most deprived geographic areas have the highest concentration of adverse outcomes

Utah students from the
least deprived groups
are
most likely to be ready
for school,
prepare for higher
education,
and attend college
or university.

Utah students from the
least deprived groups
consistently outperform
the state average
,
while students from the
most deprived areas
consistently underperform
compared to
the state average.

  • Students from the Very High deprivation areas are 40% less likely to enter kindergarten proficient in literacy than students from the "Very Low" deprivation areas.
  • In eighth grade, students from the Very High deprivation areas are 24% less likely to be proficient in English and language arts than students from a Very Low deprivation area.
  • Students from the "Very High" deprivation areas are 54% more likely to experience chronic absenteeism than students from the Very Low deprivation areas.
  • The negative relationship between deprivation and proficiency in each stage of education is shown in Figure 1. The geographic differences in deprivation and proficiency are shown in Figure 2 (the map).
Figure 1: This figure shows the percent of students who fit the requirement for each P20 metric by deprivation group.

Instructions for the map

  • This map shows the percent of students who have P20 outcomes by small area.
  • Select a P20 metric from the dropdown to see the percent of students by small area for which the outcomes occurred.
  • Darker shades indicate a higher percent who fit the definition of the P20 outcome.
  • Salt Lake County has many small areas. We recommend zooming into the map to see these areas.
  • Zoom in with your mouse scroll wheel or use the zoom tools on the map. You can reset the view of the state by clicking on the Home icon on the map tools.
  • Hover over each small area to see the percentage of students who qualify for the selected metric, the deprivation value, the deprivation group, and the geographic type.
Figure 2: This map shows the percent of students who fit the requirement for each P20 metric by Utah Small Area.*
*Note: Some Small Areas do not have schools located within the boundaries. Students were matched to Small Area based on school attended, and those Small Areas without schools do not have P20 metrics reported.More information about the reported P20 metrics can be found in the glossary.

Finding 2: Students from the most deprived small areas are likely to be part of a group already associated with adverse outcomes

Utah students from the
most deprived areas
are more likely to come
from low-income families
, have experienced
homelessness, or are
English Language Learners.

Utah students from the
most deprived areas
are
more likely to be
minorities
, than students
from the least
deprived areas.

  • Students from the Very High deprivation areas are roughly 219% more likely to have experienced homelessness than students from the "Very Low" deprivation areas.
  • Students from the Very High deprivation areas are about 240% more likely to be low-income compared to students from Very Low deprivation areas.
  • Students from the Very High deprivation areas are 774% more likely to be English language learners than students from a "Very Low" deprivation area.
  • Figure 3 demonstrates the differences between HII groups in the distribution of student characteristics, while Figure 4 shows the unequal distribution of deprivation group by different races or ethnicities.
Figure 3: This graph shows the breakdown of percent of students who fit each characteristic by deprivation group.
Figure 4: This graph shows the percent of each racial or ethnic group that resides in each deprivation group.

About Findings 3-5

This study uses probit regressions to control for gender, race/ethnicity, low-income status, rurality, English language learner status, and homeless status of students. The next three findings report predicted probabilities for each outcome for this cohort's modal Utah student: White, male, native English speaker, not low-income, never homeless and from an urban area.

Finding 3: Students from the least deprived areas are most likely to enter kindergarten prepared

Students entering
kindergarten from the most
deprived areas

are
12%
less likely to be
prepared in literacy
.

Entering kindergarten
students from the most
deprived areas

are
8%
less likely to be
prepared in numeracy
.

  • Students from the least deprived areas are the most likely to enter kindergarten prepared for literacy and numeracy.
  • Being in a higher deprivation group result in students being less likely to be prepared for school.
  • The negative relationship holds for both literacy and numeracy, though all students are more likely to be prepared for numeracy than literacy.
  • Figure 5 shows the steep drop-off in probability of entering kindergarten prepared between the Very Low and Low areas and then a slow decline moving to the next higher level of deprivation.
Figure 5: This figure shows the probability of the modal Utah student testing as proficient by deprivation group.

Finding 4: Students from the most deprived areas are least likely to attend college or university

Students from the
lowest deprivation
areas are
4%
more likely to attend
any college or university

than students from the
high deprivation areas.

Students from the
lowest deprivation
areas are
36%
more likely to attend any
college or university

than students from the
highest deprivation areas.

  • Students from the Very High deprivation areas are least likely to attend any college or university. In contrast, those from the Very Low deprivation areas are most likely to attend any college or university.
  • The difference between Low, Average, and High deprivation areas is negligible.
  • This difference points to the importance of perceived costs versus benefits of enrollment and the importance of interactions with people who have a post-secondary education.
  • The steep drop-off in attending any college or university for those from the Very High deprivation areas is demonstrated in Figure 6.
Figure 6: This graph shows the probability of the modal Utah student attending any college or university.

Finding 5: In the early grades and secondary school, students from Very High deprivation areas are the most likely to be chronically absent

First-grade students from
the highest
deprivation areas
are
22%
more likely to be
chronically absent
than
first-grade students from
the lowest deprivation areas.

Eleventh grade students
from the highest
deprivation areas
are
25%
more likely to be
chronically absent
than
students from the lowest
deprivation areas.

  • In the 1st, 2nd, 3rd, 10th, and 11th grades, the likelihood of a student being chronically absent strictly increases as the deprivation group moves from the lowest to the highest.
  • Students from the Very High deprivation areas are the least likely to be chronically absent between fifth and eighth grade. This lower likelihood of being absent coincides with eighth-grade SAGE tests, where students from the Very High deprivation areas are more likely than students from other areas to be proficient.
  • Students chronically absent in 11th grade from the Very High areas dropped out, whereas students from other areas continued on to graduate.
  • Figure 7 shows the changing relationship between deprivation and chronic absenteeism by grade level.
Figure 7: This figure demonstrates the probability of the modal Utah student being chronically absent by deprivation group and school grade.

Limitations

  • This study matched students to Small Areas based on which school reported the respective student's outcomes. As catchment areas increase moving from primary to secondary school, some students are likely matched to the wrong Small Area.
  • Post-secondary outcomes for this study only include students that attend a public college or university in the Utah System of Higher Education (USHE).
  • This study can only control for low-income status and not overall income, obscuring the difference between those just above the low-income income cutoff and those with very high incomes.

Conclusion

  • The area in which a student lives relates to the student's success: Area deprivation matters.
  • Students in the highest deprivation areas are the least likely to prepare for school and attend any college or university.
  • The relationship between chronic absenteeism and area deprivation is more complex; there is a negative relationship between deprivation and chronic absenteeism for the earliest and latest school years. However, this relationship disappears in the middle grades.
  • The years where students from the Very High deprivation areas are least likely to be chronically absent coincide when they are more likely to be more proficient than those from the High and Average deprivation areas.

Full Report

Learn more about utah's Area Deprivation and P20 Pipeline

The full report provides a deeper look at the relationship of area deprivation and P20 metrics in Utah. The report contains breakdowns of each P20 metric of interest and tests against the state average and each deprivation group. The report also contains regression analysis to control for individual characteristics of students to allow for a more robust test of the relationship between deprivation (HII) and P20 metrics. The report also provides a potential theoretical framework for why this relationship exists.

Report cover

Glossary

Project
Team

Ari Fenn
Ari Fenn, PhD

Researcher
(Analysis/
Report Author)

Laura Dahl
Laura Dahl, PhD

UX Researcher
(Graphics/
Web Design)