Overview
This study aims to investigate the gender wage gap experienced by Utahns. Utah has consistently ranked with one of the widest gender wage gaps in the nation.
This study combines wage data obtained from the Utah Department of Workforce Services (DWS) with graduates who received a certificate from a technical college or a degree from an institution in the Utah System of Higher Education (USHE) and includes cohorts from 2012 to 2014.
The gender wage gap experienced by these graduates is broken down by the highest educational attainment, age group, and Classification of Instructional Program (CIP) studied.
It is important to examine the gender wage gap now as the gap has narrowed from the late 1970s to the 1990s. However, progress in closing the gender wage gap has been relatively stagnant since then. Basic economic theory informs us that closing the gender wage gap might encourage women to increase participation in the workforce—helping to maximize women’s economic security and potential.
About the Utah Participants: This research included 67,013 graduates from USHE degree-granting institutions (35,190 women and 31,823 men) and 10,788 graduates from USHE technical college (5,713 women and 5,075 men).
Finding 1: Utah's gender wage gap is larger than the U.S. wage gap
Overall in Utah,
women made
69%
of men's wages
Utah women with a
bachelor's degree made
62%
of men's wages
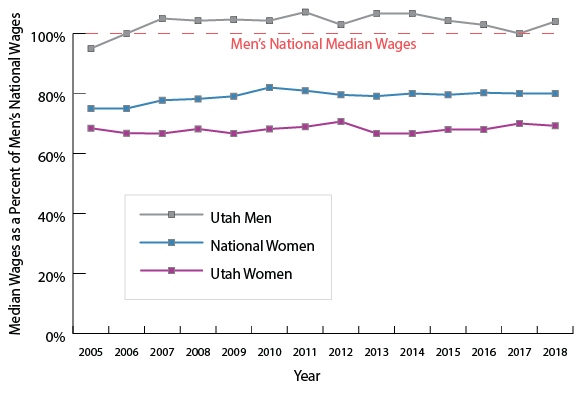
- Using the American Community Survey (ACS) data, women made 53.3% of men's median wage in Utah compared to the U.S. earnings ratio of 69% in 2018.
- Figure 1 shows that in 2018, Utah women made 69.2% of Utah men's median wage compared to the U.S. earnings ratio 80% for those who worked full-time, while Utah men made 104% of national men's median wage.
- Analyzing the ACS data further illustrates that in 2018, those with a high school degree or equivalent have the most equity in wage (72.5%), while those with a bachelor's degree (62.1%), some college (63.8%), and an advanced degree (64.5%) experience the largest gender wage gaps in Utah.
Finding 2: Utah women face a large wage gap one year after graduating from an academic institution or technical college
Of graduates from an
academic institution who
were strongly attached
to the workforce,
women made
77%
of men's wages
after one year
Of graduates from a
technical college who
were strongly attached
to the workforce,
women made
58%
of men's wages
after one year
- For the entire group of 2014 USHE graduates, including those who worked only part of the year, we found the following about the first year:
- Those graduating from an academic institution made 58.3% of men's salary.
- Those graduating from a technical college made 48.4% of men's salary.
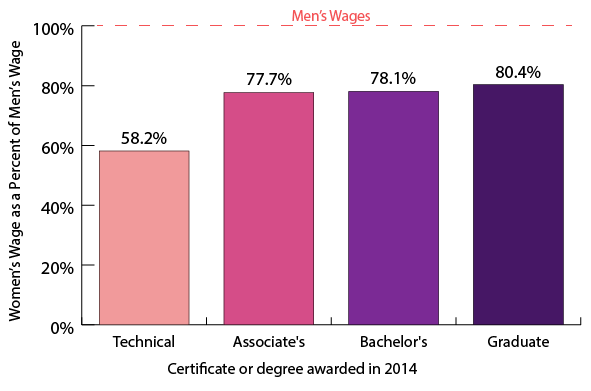
- For the group of 2014 graduates that consistently worked the four quarters of the year and made at least an average of the minimum wage (as an approximation of working full-time), we found the following about the first year (as shown in Figure 2):
- One year after graduation, women made 77.4% of men's salary — 77.4% is an aggregation of all USHE graduates with full-time status.
- One year after women graduated from a technical college, they earned 58.2% of what men received in their salaries — 58.2% is an aggregation of all UTECH graduates with full-time status.
- These findings are relatively consistent across cohorts from 2012 through 2014.
- Among the most popular fields of study at academic institutions, the most equality occurs in the field of education, where women made on average 94.7% of men's wage one year after graduation.
- The highest pay inequality occurs in business management, where women made 81.7% of men's wages one year after graduation.
- Many fields of study in technical colleges did not meet the study requirement of 30 observations for each field.
- However, the trend shows occupational segregation within technical and career training.
- Enough data for the healthcare profession were observed and showed that women made 83.1% of men's wages one year after graduation.
- Please refer to the full report for a list of wage comparisons for the top areas of study.
Finding 3: After college graduation, the wage gap changes over time
After 5 years,
women who graduated
from an
academic institution
had their earnings ratio
decrease to
72%
After 5 years,
women who graduated
from a
technical college
had their earnings ratio
slightly increase to
61%
- The gender wage gap grows significantly worse from the first year of graduation to the fifth year for all cohort years.
- For those who consistently worked throughout the year, each level of educational attainment showed a statistically significant difference in how wage changes over time between men and women.
- For 2014 academic institution graduates, women's earnings ratio decreased from 77.4% one year after graduation to 72.1% five years after graduation.
- For 2014 technical college graduates, women's earnings ratio increased slightly from 58.2% one year after graduation to 61.0% five years after graduation.
- In terms of dollars, women made $36,300 annually in Utah compared to the $40,000 national average.
- This difference in wages is especially striking as women in Utah tend to earn lower wages than the national average, while men in Utah tend to make more.
- Men in Utah with less education often earn more than women with higher levels of educational attainment.
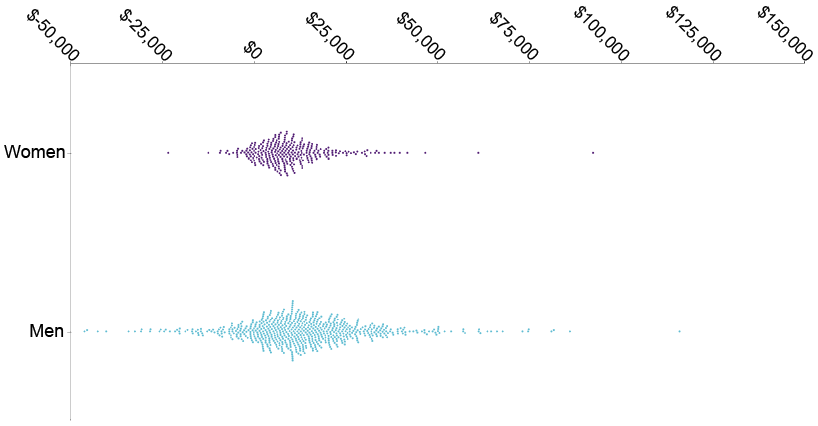
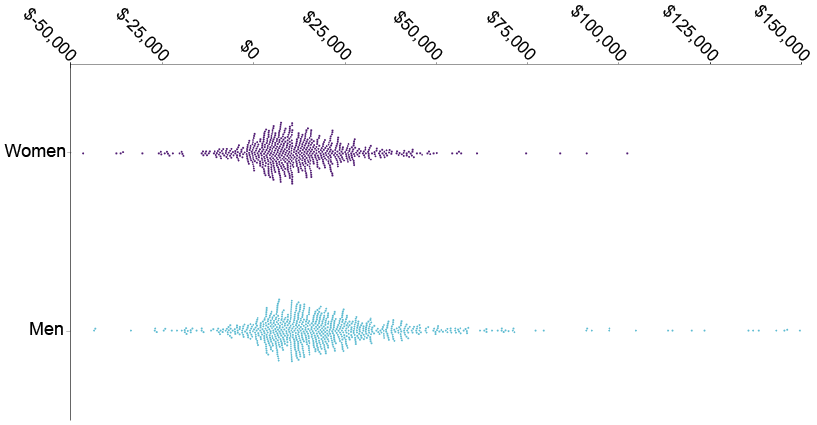
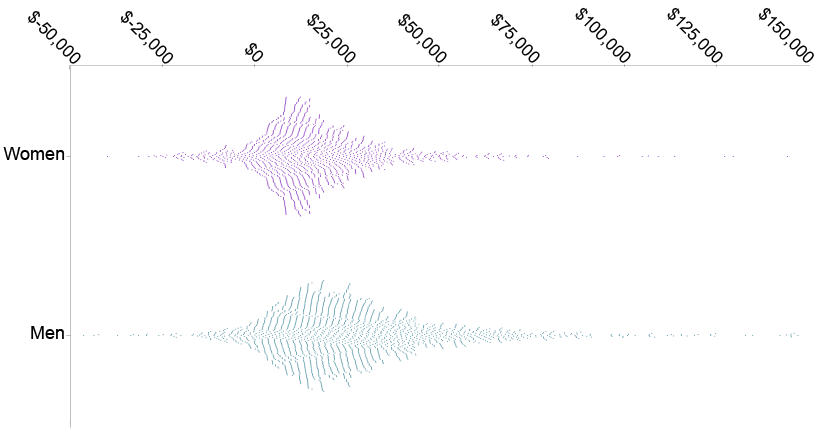
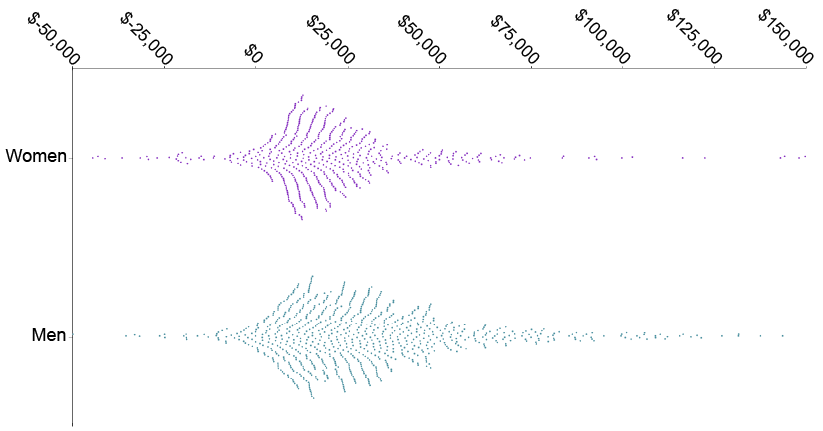
- Please see the following swarm plots in Figures 3-6 to see the differences in men's and women's wage growth for each educational attainment. Each dot in the swarm plot represents the change in wages for an individual from one year to five years post-graduation.
Each swarm plot shows the distribution of post-graduation wage growth values for the considered individuals. Looking at Figure 5, most data points for women fall below $25,000, while the majority of data points for men are above $25,000. This difference illustrates that wage growth for most women is less than $25,000, while wage growth for most men is at least $25,000 from one year to five years post-graduation.
Men's wage growth for all educational attainment levels shows a longer right tail on the horizontal axis than women's wage growth. This right tail illustrates that more men experience large wage growth than women regardless of educational attainment.
Finding 4: Utah's wage gap cannot be entirely explained by human capital measures
Over
70%
of the gender wage gap
CANNOT be explained
by education,
experience, or age
Under
30%
of the gender wage gap
CAN be explained
by education,
experience, or age
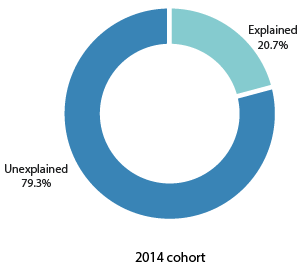
- For all cohorts studied, over 70% of the wage gap cannot be explained by age, skills, knowledge, and experience.
- The mean wage difference was examined using the Blinder-Oaxaca decomposition, which splits the wage gap into explained difference and unexplained difference.
- Explanatory variables for this model included age, prior work experience, and highest educational attainment.
- The wage gaps were separated into what can be described using explanatory variables and the unexplained portions. Figure 7 shows the explained and unexplained portions of the wage gap for the 2014 cohort five years post graduation.
Limitations
- DWS wage data do not include occupations or job roles for individuals.
- DWS wage data are quarterly aggregates and do not include hourly or monthly pay.
- Only USHE graduates are included in this study. Some post-secondary institutions in Utah were not included, such as Brigham Young University and Westminster College.
- DWS wage data do not contain the number of hours worked. An approximation was used by examining wages earned each quarter to resemble whether a worker was strongly attached to the workforce as an alternative to full-time status.
- DWS wage data do not include income from self-employment, federal employment, or non-profit agencies. Other incomes such as dividends, real estate are not included. Finally, any income earned outside of Utah is not available.
Conclusion
Overall, this study illustrates that women in Utah consistently make less than men regardless of age, experience, educational attainment, or field of study.
In Utah, the gender wage gap is bigger than the national average wage gap.
Wage data suggests a widening gender wage gap as more time is spent in the workforce.
The gap cannot be explained entirely by prior work experience, age, or highest educational attainment.
Full Report
Learn more about Utah's gender wage gap
Read the full report to learn more about the gender wage gap of Utah workforce and post-secondary graduates. This study also includes detailed breakdowns of recent graduates by degree, CIP, and age. Wage growth for men and women post-graduation is compared. Wage difference is decomposed into what can be explained by human capitals and the unexplained portion.
Project
Team

Karen Tao
Researcher
(Analysis/
Report Author)

Skylar Scott
Senior Researcher
(Analysis/
Report Author)

Laura Dahl, PhD
UX Researcher
(Graphics/
Web Design)