Deep Dive Series: Frequestist and Bayesian Statistics
Karen Tao, UX Researcher
August 26, 2020

Photo by Cameron Vaughan
In last week’s blog post, we learned how to write our Bayesian model in R. But what is Bayesian statistics? And how is it different from frequentist statistics? We will explore them in this post.
Bayesian expresses probability as a degree of belief in an event. The degree of belief may be based on our prior knowledge about the event. We update our beliefs when new evidence becomes available. This means that the model is best used many times: the more evidence we have, the more sure we are about our model. In Bayesian inference, probability is a measure of uncertainty. On the other hand, frequentists may view probability as the frequency of repeated events. It is the limit of the relative frequency of an event after many trials.
Let’s say I am wondering about the probability that I will go camping this weekend. The frequentist approach may count how many weekends I’ve gone camping in the last 10 years, and divide that by 520 (52 weeks per year x 10 years). For example, if I had gone camping 200 times in the last 10 years, this probability would be 200/520 = 38%. The probability equals to the long-term frequency of camping. For frequentists, the model is fixed, but the data can vary. Using a Bayesian approach, we may observe that I may not go camping when friends are visiting from out-of-state, unless I go camping with my out-of-state friends. Knowing my friends visit 10% of the weekends every year, and that 20% of the time I went camping I was with my out-of-state friends, we can now update our model.
Below is Bayes’ theorem, the formula used in Bayesian statistics.
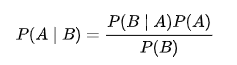
In our example, the event of going camping is event A. P(A) is the probability that we will go camping. The event that my friends are visiting is event B. P(B) is the probability that I will have friends from out-of-state visiting. P(A|B) is the probability that I will go camping given my friends are visiting. P(B|A) is the probability that my friends are visiting given I am camping. We will break down the parts of this formula further:
-
P(A): Prior probability -- this reflects our prior probability of going camping: 38%
-
P(B|A): Likelihood of observations given the model-- this reflects the probability that I have out-of-state friends with me when I camp, which is 20%
-
P(B): Evidence--this is how often my friends visit: 10%
-
P(A|B): Posterior probability--this is what we are trying to find out. What’s the probability that I will go camping given my out-of-state friends are visiting?
We can now find out P(A|B) = (20% * 38%) / 10% = 76%
I have 76% probability of going camping when my friends are visiting! Bayesian statisticians think that the data are observed and fixed, but the model can vary. This allows us to update our models, or measure of beliefs, in response to our observations, or data. The stronger the prior belief, the more certain we become about our model.
What can we do with Bayesian inference? One machine learning model that you may already use daily without realizing, is email spam filtering. More specifically, the probability of an email being a spam is modeled given certain words appear in the email, such as prince, beneficiary, inherit. Another example for calculating probability that may be relevant is the test results for certain diseases. If you were to get tested for COVID-19, and the result was positive, what is the probability that you have the virus? To answer that, we would need the true positive rate and the false positive rate, or sensitivity and specificity of the tests. Here at the UDRC, we plan to implement a Bayesian approach for our future version of the master person index for record linkage, which is the process of matching data from different data sources when they refer to the same individual. Given data from two different sources, we model the probability that they belong to the same individual.
We have only scratched the surface with Bayesian statistics. Below are some resources to get even more of Bayesian (some even include R code to get your hands dirty):
-
A python implementation of the Bayesian model using the Iris dataset. See last week’s blog for an R implementation.
-
choosing a prior density function
-
Finally, here is a classic textbook that’s free.
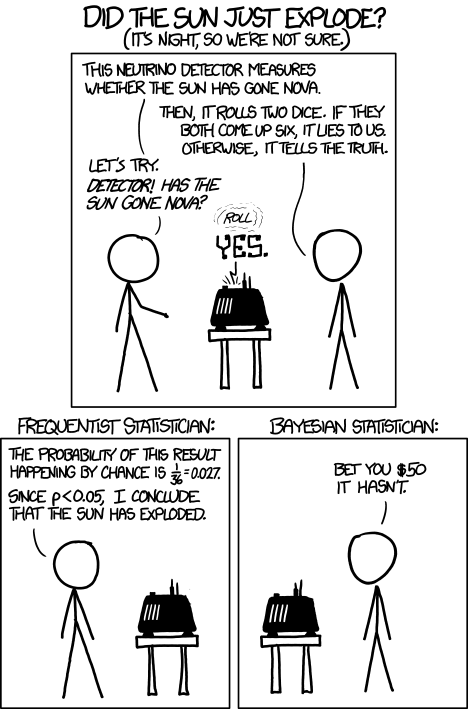
Unlike what the xkcd comic suggests, Bayesian approach is not always superior to frequentist approach. While different, frequentists and Bayesian inferences both have their rightful spots in statistics. They are both tools in the data scientist’s tool belt. Data scientists should use critical thinking to choose the technique appropriate for the task. What we try to accomplish with data should ultimately determine which tool we use.